Financial projections form the backbone of startup valuation. While qualitative methods like our Scorecard and Checklist approaches provide valuable insights by comparing startups against peer averages, they can only take you so far. Venture capital is fundamentally about identifying and funding outliers—companies that will vastly outperform the average. For this reason, revenue projections and EBITDA projections serve as perhaps the primary means by which we understand the value of companies, as they most clearly reflect future potential, future growth, and the core of value, which ultimately is cash flow generation.
Yet founders face a paradox when building financial projections: how do you balance ambition with credibility? How do you demonstrate that your startup can be an outlier without appearing delusional? The answer lies in understanding how to use benchmarking data strategically—not as a ceiling for your ambitions, but as context for your narrative.
The Financial Projections Challenge
The challenge with financial projections is twofold:
First, there’s a general lack of available data to help either founders or investors understand what constitutes reasonable growth rates, margins, or scaling patterns. Unlike public companies with transparent financial statements, private startup data is fragmented, often unreliable, and difficult to access.
Second, even when you know what’s “reasonable,” that’s not necessarily relevant to a company that intends to be an outlier. The median performance of startups in your sector might be completely irrelevant if you’re building something genuinely disruptive.
This combination of factors makes understanding financial projections extremely difficult—never mind actually assembling and benchmarking them. This challenge is a large part of the reason why venture capital has gravitated towards using comparative pricing in recent years through crude tools like ARR multiples.
However, as any deep tech or biotech founder knows, these approaches don’t work particularly well for truly novel ideas. This connects directly to our core philosophy about the difference between pricing and valuation—a distinction that becomes critical when you’re building something the market hasn’t seen before.
Benchmark your startup with the largest valuation database
Context, Not Constraints
At Equidam, we provide benchmarking information as part of our comprehensive valuation process. In addition to valuation, funding targets, and dilution analysis, we offer benchmarks for revenue growth, EBITDA growth, and EBITDA margins. But here’s the crucial point: this data provides context, not constraints.
The benchmarks serve three primary purposes:
- For Founders: They offer perspective on how ambitious your projections appear relative to your peer group, helping you craft a more informed narrative about your growth trajectory.
- For Investors: They provide a baseline for evaluating whether a startup’s projections are grounded in market reality or floating in founder fantasy.
- For Both Parties: They create a shared reference point for productive discussions about growth assumptions and risk factors.
That’s not to say that the benchmark should inform projections, or that founders should aim to be close to the median, or that investors should be skeptical if projections significantly exceed benchmarks. Rather, the data provides context, making it clear how ambitious a startup is being about their future in relation to the pool of comparable companies.
Understanding Key Benchmarking Metrics
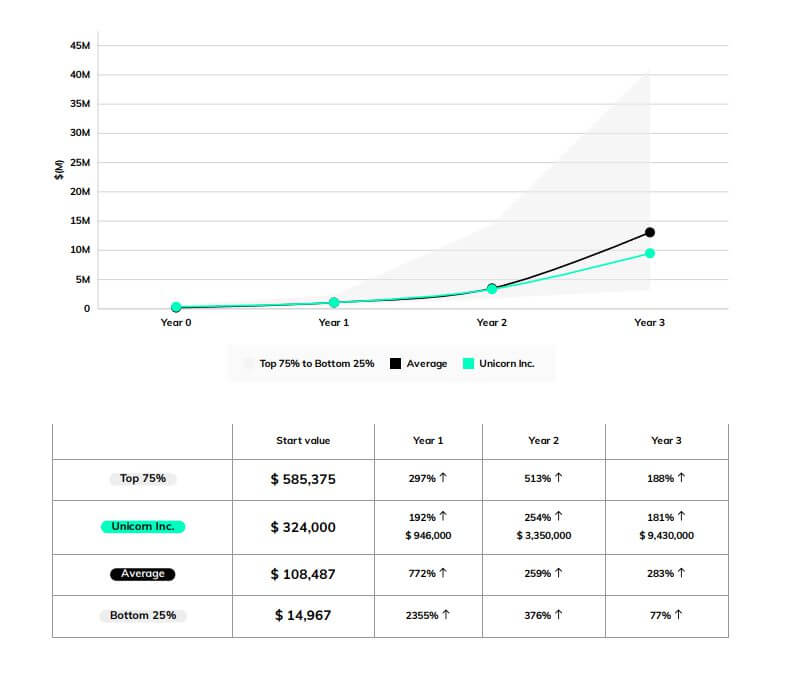
Revenue Growth Benchmarks
Revenue growth is one of the two variables (along with EBITDA growth) with the most significant impact on a company’s valuation. Our revenue growth benchmark chart compares your company against the median of Equidam’s dataset, as well as against the 25th and 75th percentiles. This means that 50% of comparable companies fall within the grey area between these percentiles. Revenue growth benchmarks help founders understand whether their projected scaling trajectory aligns with market patterns or represents a significant outlier position that will require additional justification to investors.
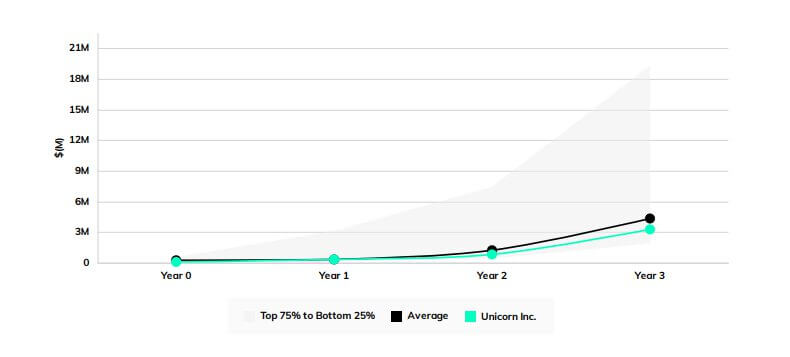
EBITDA Growth Benchmarks
EBITDA (Earnings Before Interest, Taxes, Depreciation, and Amortization) measures a company’s profitability from operations. Given its significant impact in determining cash flow—the ultimate driver of company value—it deserves special attention in any valuation analysis. Our EBITDA growth chart displays your company’s forecasted EBITDA for the upcoming three years, comparing it to the median and 25th and 75th percentiles of comparable companies. This benchmark is particularly valuable because it reveals not just your growth ambitions, but your path to profitability and sustainable cash generation.
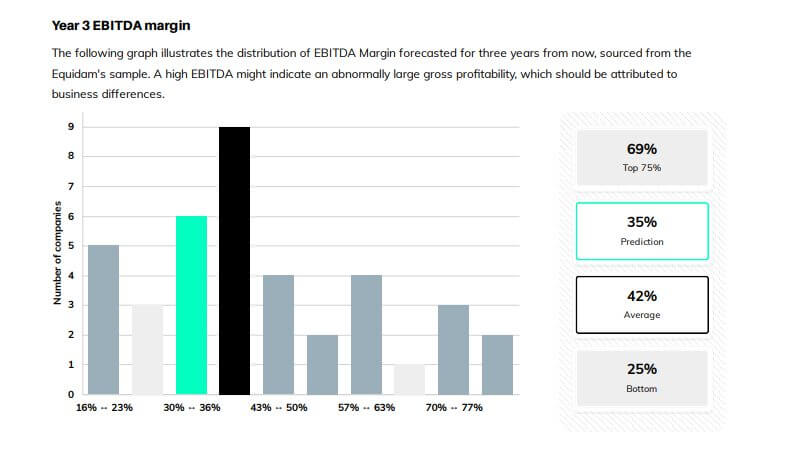
EBITDA Margin Benchmarks
The EBITDA margin benchmark illustrates the distribution of EBITDA margins forecasted for three years from now, sourced from Equidam’s sample of comparable companies. A significantly high EBITDA margin compared to peers might indicate exceptionally strong unit economics or operational efficiency, but it could also suggest overly optimistic assumptions that should be attributed to specific business model differences. Conversely, lower margins might reflect a capital-intensive scaling strategy or early-stage inefficiencies that will improve over time.
How to Use Benchmarking Data Effectively
1. Start with Your Strategy, Not the Market
Financial projections should be a coherent reflection of your vision and strategy. Begin by mapping out your business model, understanding your unit economics, and building projections based on your specific go-to-market approach. Only after you have a defendable model should you look at how your projections compare to market benchmarks.
2. Use Benchmarks to Strengthen Your Narrative
If your projections significantly exceed market benchmarks, that’s not necessarily a problem—but it does require explanation. Be prepared to articulate:
- What specific advantages do your team, technology, or approach provide?
- Which assumptions drive your superior performance expectations?
- What evidence supports your belief that you can outperform peers?
- How you plan to execute at a level that justifies the projections?
3. Understand the Benchmark Pool
Not all benchmarks are created equal. When reviewing comparative data, consider:
- Are you comparing against companies at similar developmental stages?
- Were the benchmark companies scaling in different economic conditions?
- Do the comparables have similar unit economics and scaling patterns?
- Are there regional differences that might affect growth trajectories?
4. Acknowledge Uncertainty Appropriately
Solid financial projections provide a foundation that better prepares the company for future challenges. Rather than presenting projections as certainties, frame them as your best estimates based on current information. Show that you’ve considered different scenarios and understand the key variables that could affect your trajectory.
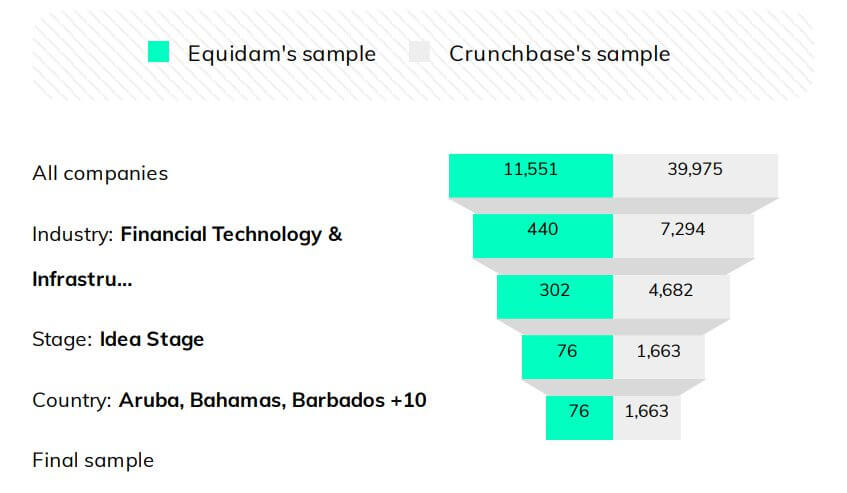
Benchmark Filtering
Equidam’s benchmarking sample is drawn from our own valuation database (always anonymised and aggregated) as well as transactions in the Crunchbase database (for valuation, fundraising and dilution benchmarks). Users can apply three successive filters to hone in on the most relevant peers: first by industry category (e.g. Financial Technology & Infrastructure), then by stage of development (e.g. Idea Stage), and finally by geographic region (in this example, North America). At each step, the funnel narrows, yielding a smaller, more targeted peer set for comparison.
What Benchmarking Reveals About Your Startup
When your projections are contextualized against market data, several insights emerge:
If you’re projecting above-median performance: You’re positioning yourself as a potential outlier. This isn’t inherently good or bad—it simply signals ambition that requires justification through superior execution capabilities, market positioning, or technological advantages.
If you’re projecting median performance: You may be taking a conservative approach, which can appeal to risk-averse investors but might also signal limited upside potential for venture-scale returns.
If you’re projecting below-median performance: You might be in an earlier stage, targeting a different market, or dealing with specific challenges that require additional capital or time to overcome. For the purposes of valuation, this is where you might want to consider extending your projections to the point where growth accelerates and can be accounted for.
Each position has merit depending on your specific circumstances, but understanding where you sit relative to peers helps you craft the appropriate narrative.
The Outlier Imperative
Venture capital firms raise funds from limited partners and deploy capital into startups, seeking outsized returns. VCs invest with the expectation of achieving high returns upon exit to compensate for the high risk and illiquidity of their investments and the likelihood that many portfolio companies will fail.
This reality means that while benchmarking data provides useful context, investors are ultimately looking for companies that can deliver venture-scale returns—often 10x or more on their investment. The median performance of your peer group is unlikely to generate these returns, which is why truly exceptional startups often need to project well above market benchmarks.
The key is being able to justify why your startup can achieve exceptional performance. This requires:
- Demonstrating that you grasp both the opportunity size and the challenges involved
- Showing that your team has the skills and experience to deliver on ambitious projections
- Articulating what makes your approach different and defensible
- Providing early indicators that support your growth assumptions
Practical Application
When preparing your financial projections and valuation:
- Build your model based on your specific business drivers and strategy
- Benchmark your projections against relevant peer data to understand your relative positioning
- Prepare your narrative explaining any significant deviations from market norms
- Use the context to strengthen investor conversations and demonstrate market awareness
- Focus on fundamentals rather than trying to manipulate projections to match or exceed benchmarks
Remember: the best startups are valued, not priced. Your projections should reflect your genuine assessment of your business potential, informed by market context but not constrained by it.
Conclusion
Financial projections remain the most direct way to communicate your startup’s potential value creation. Benchmarking data provides crucial context for these projections, helping both founders and investors understand the ambition level and risk profile implicit in the financial forecast.
The goal is not to match market averages—venture capital is about finding outliers—but rather to provide transparent context that enables productive discussions about assumptions, risks, and potential.
By using benchmarking data as context rather than constraint, founders can build more credible projections while maintaining the ambitious vision necessary for venture-scale success. The key is being able to articulate why your startup can outperform the market, backed by evidence and a clear understanding of your competitive advantages.
Used wisely, benchmarking data becomes a tool for stronger storytelling, better investor alignment, and more informed strategic planning—all critical elements for successful fundraising and long-term company building.