Out of 100 companies that applied to angel groups in 2024, only 2 reached an investor’s portfolio. This stark statistic from the most comprehensive analysis of startup funding applications reveals a harsh reality that most founders refuse to acknowledge: external funding is not just competitive—it’s statistically improbable.
While startup media celebrates billion-dollar rounds and unicorn valuations, the mathematics of early-stage funding tell a different story. The gap between perception and reality has never been wider, leaving thousands of founders chasing funding opportunities with odds worse than getting into Harvard Business School.
Understanding these probabilities isn’t about discouraging entrepreneurship—it’s about strategic clarity. Whether you’re preparing your first pitch deck or wondering why your “obviously fundable” startup keeps getting rejected, the data reveals patterns that can fundamentally reshape your approach to building and funding a company.
This analysis draws from the most authoritative datasets available, including over 12,000 funding applications analyzed by the Angel Capital Association, insights from leading investors like David Rose, and platform data from companies that actually process these transactions daily.
The Comprehensive Statistical Analysis
The Most Authoritative Data: Angel Capital Association + Dealum
The Angel Capital Association’s recent analysis provides the most comprehensive view of startup funding probabilities available. Working with Dealum, the leading deal flow platform used by angel networks worldwide, they analyzed over 12,000 funding applications submitted between 2022-2024.
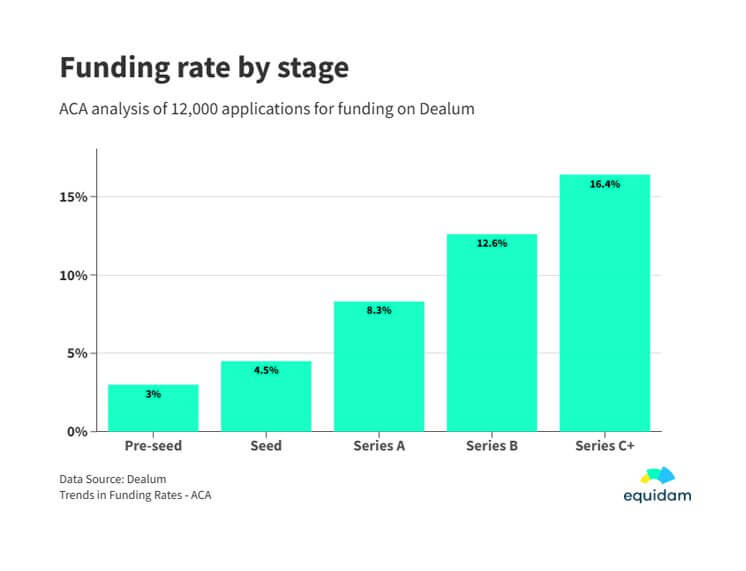 The results are sobering:
- Pre-seed funding rate: 3% – Only 3 out of every 100 pre-seed applications receive funding
- Seed funding rate: 4.5% – Slightly better odds, but still under 1 in 20
- Series A: 8.3% – Improving odds for companies that survive to this stage
- Series B: 12.6% – Continued improvement with maturity
- Series C+: 16.4% – The best odds, but only for companies that have made it this far
As the ACA notes: “Apparently, the systematic reduction in risks as companies grow and mature has a direct correlation with the likelihood of funding.”
The Dealum platform data reinforces this reality. Across their network of angel investors and groups, only about 2% of applicants end up in investors’ portfolios, and it takes a median of 37 days for a company to receive investment from angels.
These aren’t theoretical numbers—they represent real applications from real startups seeking real money from professional investor networks.
Cross-Validation: Industry Expert Insights
David Rose, founder of Gust and one of the world’s most active angel investors, has long cited the “1-in-40 rule” for angel investing. As he explains on Quora, angel investors typically look at 40 companies for each one in which they invest.
Venture capitalists are even more selective. Top-tier VCs often cite a 1-in-400 ratio, meaning they fund just 0.25% of the deals they review. This selectivity isn’t arbitrary—it’s driven by the mathematical requirements of generating returns in a power law distribution market.
Y Combinator, arguably the world’s most successful accelerator, provides another data point. Their investor resources page notes that over 10,000 companies apply every three months, with typically a 1% acceptance rate. Even this “startup factory” can only fund 100 companies per batch from thousands of applications.
The Broader Venture Capital Context
To understand these probabilities, consider the entire startup ecosystem. In the United States alone, approximately 700,000 companies incorporate and hire at least one employee annually. Of these, research consistently shows that only 0.05% ever raise venture capital.
This means that 99.95% of all new businesses never receive professional investment. The vast majority—77% according to Gallup polling—rely on the personal savings of their founders for initial capital needs.
Even among the small percentage that do seek external funding, success is far from guaranteed. The numbers reveal a brutal selection process where only the most exceptional companies, with the strongest teams, in the largest markets, at the right time, manage to secure professional investment.
Market Cycle Impact on Probabilities
These already-low probabilities fluctuate significantly with market conditions. The ACA data shows dramatic variation:
- 2022: 9.2% overall funding rate (during the late-stage funding boom)
- 2023: 4.3% funding rate (market correction and rising interest rates)
- 2024: 7.3% funding rate (partial recovery)
- Three-year average: 6.1% overall funding rate
The dramatic drop in 2023 illustrates how external factors beyond company control can halve funding probabilities overnight. As interest rates rose and public markets corrected, investor risk appetite plummeted, making an already difficult process nearly impossible for many startups.
Stage-by-Stage Progression Analysis
The Funding Journey Probabilities
Understanding funding probabilities requires examining the entire journey, not just initial funding rates. Crunchbase analysis reveals the compounding challenges:
From Seed to Series A: Only 1 in 3 startups that raise seed funding successfully raise a Series A round. This 33% progression rate means that even after proving worthy of initial investment, two-thirds of companies fail to reach the next stage.
Alternative research suggests even grimmer odds. Some studies indicate that fewer than 10% of seed-funded companies ultimately reach Series A funding.
From Series A to B: Approximately 35% of Series A companies fail before raising Series B funding. However, survival odds improve dramatically for companies that make it this far.
Series B and Beyond: The failure rate drops to just 1% for companies that reach Series B, as they’ve demonstrated significant market traction and business model validation.
The Compounding Mathematics
These stage-by-stage probabilities create a mathematical nightmare for startups. Consider a hypothetical company’s journey:
- Chance of raising pre-seed: 3%
- Chance of progressing to seed: 67% (of those funded)
- Chance of reaching Series A: 33% (of seed-funded companies)
- Overall probability from idea to Series A: 3% × 67% × 33% = 0.66%
This means less than 1 in 150 pre-seed applications will ever reach Series A funding—and these calculations assume the company survives each transition, ignoring operational failures between rounds.
Survival vs. Success Rates
Even securing funding doesn’t guarantee success. David Rose’s analysis of angel-funded company outcomes shows that approximately 50% of angel-funded companies ultimately fail completely, providing no return to investors.
For VC-backed companies, Harvard Business School’s Shikhar Ghosh found that 75% of venture-backed companies never return cash to investors, and in 30-40% of cases, investors lose their entire initial investment.
This data reveals a crucial distinction: getting funded and achieving success are two entirely different probabilistic challenges.
The Investor Perspective: Why Rejection Rates Are Extreme
Portfolio Mathematics Drive Selectivity
The extreme selectivity isn’t arbitrary—it’s mathematically required by the venture capital model. Venture investing operates on a power law distribution where a small number of massive successes must compensate for a large number of failures.
Professional investors need portfolio companies that can return 10x or more on their investment to offset the inevitable losses. As noted in research on venture capital selection criteria, top funds that receive substantial deal flow often fund only 0.5% to 1% of applications.
David Rose recommends that angel investors diversify across at least 20-25 companies over five years specifically because most investments will fail. This mathematical requirement drives the extreme selectivity that founders experience.
Investor Psychology and Experience
The selectivity intensifies with investor experience. David Rose notes that “a novice angel will love one out of the first ten deals he sees, and one out of the first hundred, and one out of the first thousand.” Experienced investors develop pattern recognition that makes them increasingly selective.
This creates a challenging dynamic for founders: the most accessible investors (novices) often lack the capital or network to be truly helpful, while the most valuable investors (experienced angels and VCs) are extraordinarily selective.
Structural Market Forces
Several structural factors compound the selection pressure:
Capital concentration: The best opportunities often attract multiple investors, creating competitive bidding situations where only the most compelling companies receive offers.
Quality distribution: Despite founders’ beliefs in their companies, the reality is that most startups genuinely lack the combination of team, market, product, and timing necessary for venture-scale returns.
Market efficiency: Information flows quickly in investor networks. When a truly exceptional opportunity emerges, it’s often funded rapidly by multiple investors, leaving the vast majority of other companies competing for remaining capital.
What Determines Your Odds & How to Improve Them
Validation and Traction Signals
The ACA analysis reveals specific factors that dramatically improve funding odds:
Corporate structure and legal foundation: Companies that have properly incorporated and established legal structures see higher funding rates. This signals professionalism and commitment beyond casual entrepreneurship.
Action item: Formally incorporate your company and establish proper legal structure before seeking professional investment. This basic step eliminates you from the pool of “idea stage” companies that angels rarely fund.
Prior funding and lead investors: Having existing investors, especially credible lead investors, creates social proof that significantly improves odds. The ACA data shows that “funding rates are higher when there is validation in terms of the presence of a lead investor.”
Strategy: Secure smaller initial investments from credible angels or funds who can serve as lead investors for larger rounds. Their due diligence and reputation become leverage for attracting additional capital.
Accelerator experience: Companies that have participated in reputable accelerators see improved funding rates due to third-party validation and training.
Consideration: While Y Combinator accepts only 1% of applicants, numerous other quality accelerators offer better odds while still providing valuable validation and training.
Team and Execution Factors
Research consistently shows that team quality is the strongest predictor of startup success:
Founder experience matters: Studies indicate that serial entrepreneurs have a 20% success rate versus 18% for first-time founders. While the difference is modest, experience with previous ventures (even failed ones) provides credibility with investors.
Strategy: If you’re a first-time founder, consider bringing on co-founders with previous startup experience, or surround yourself with experienced advisors who can provide credibility and guidance.
Team completeness: Investors look for teams that cover both technical and commercial functions. Single founders or teams with significant skill gaps face additional skepticism.
Action: Identify and fill critical skill gaps in your founding team before fundraising. A complete team reduces execution risk in investors’ minds.
Execution track record: The ability to consistently hit stated milestones and demonstrate progress builds investor confidence more than any pitch deck.
Focus: Establish a pattern of setting realistic goals and achieving them. This track record becomes your strongest argument for future success.
Market and Product Positioning
Problem urgency classification: Investors distinguish between “must-solve” and “nice-to-solve” problems. Companies addressing urgent, expensive problems for customers see higher funding rates.
Evaluation: Honestly assess whether your solution addresses a critical pain point that customers will pay to solve, or merely an interesting opportunity.
Market size validation: Credible Total Addressable Market (TAM) and Serviceable Addressable Market (SAM) analysis significantly improves funding odds.
Research requirement: Develop rigorous, bottom-up market size analysis with multiple validation sources. Avoid the common mistake of using top-down “if we capture 1% of this huge market” reasoning.
Competitive differentiation: Clear, defensible competitive advantages are essential for investor confidence.
Positioning: Articulate specific reasons why your solution will win against both current competitors and well-funded future entrants.
Professional Presentation and Network Access
Data-driven presentations: Investors respond to concrete metrics, customer validation, and realistic financial projections rather than aspirational claims.
Preparation: Develop comprehensive metrics around user acquisition, retention, revenue progression, and unit economics. Present realistic scenarios rather than hockey-stick projections without clear inflection points.
Warm introductions vs. cold outreach: Success rates for warm introductions exceed cold outreach by orders of magnitude.
Networking strategy: Identify paths to warm introductions through your existing network, customers, advisors, or other portfolio company founders. Cold emails to investors rarely succeed.
Investor-market fit: Targeting investors who focus on your stage, sector, and geographic market dramatically improves response rates.
Research: Use platforms like Crunchbase, PitchBook, or Gust to identify investors with relevant portfolios and investment criteria before outreach.
Alternative Funding Strategies
Given the low probabilities of traditional funding, smart founders develop multiple capital strategies:
Friends and family funding: This typically has much higher success rates because investors are betting on the founder rather than the business. It also provides initial capital to achieve milestones that make professional funding more likely.
Revenue-based financing: Growing alternatives like revenue-based financing offer capital without equity dilution, though typically at higher costs than traditional venture capital.
Crowdfunding approaches: Platforms like Kickstarter or Indiegogo can provide both market validation and initial capital, creating traction that improves professional investor odds.
Strategic bootstrapping: Research on capital efficiency shows an inverse correlation between capital raised in early rounds and ultimate startup success. Building a capital-efficient business may be more valuable than raising external funding.
Sector Variations and Current Trends
Hot vs. Cold Sectors (2024)
Funding probabilities vary significantly by sector, reflecting investor appetite and market dynamics:
Artificial Intelligence startups: Despite premium valuations, AI startups face high failure rates. As noted in industry analysis, 85% of AI startups will fail within three years, either acquired by larger companies or running out of capital.
Financial Technology: FinTech attracts substantial funding when successful, but statistics show up to 75% failure rates, often due to regulatory compliance challenges.
Healthcare and BioTech: These sectors show 15% higher five-year survival rates compared to average, reflecting longer development cycles and higher barriers to entry.
E-commerce: Despite substantial market size, e-commerce startups face approximately 80% failure rates due to intense competition and challenging unit economics.
Current Market Dynamics
Interest rate impact: Rising interest rates dramatically affect funding availability. As the risk-free rate increases, investors demand higher returns from risky assets like startups, reducing funding rates across all stages.
Investor risk appetite: Market cycles create rotation between high-risk, high-reward investments and safer alternatives. Understanding these cycles helps time fundraising efforts.
Emerging opportunities: New categories like climate tech, aging tech, and space commerce may offer better odds due to reduced competition, though market validation remains challenging.
Reality Check and Strategic Implications
The Sobering Truth
The data leads to uncomfortable but important conclusions:
2-3% success rate is the baseline expectation for external funding in the current market. This isn’t a temporary downturn—it’s the mathematical reality of a selective investment ecosystem.
Most startups should plan without external funding as their primary strategy. Building a business that can succeed through customer revenue, rather than investor capital, provides both independence and optionality.
Focus on building fundable businesses rather than optimizing for fundraising. The most fundable companies are often those that don’t desperately need funding because they’ve achieved strong unit economics and sustainable growth.
Strategic Frameworks
Value creation first: Equidam’s approach to startup valuation emphasizes building businesses with intrinsic value based on sustainable unit economics and defensible market positions, rather than chasing inflated valuations driven by market hype.
Capital efficiency: Research consistently shows an inverse correlation between capital raised in early rounds and ultimate startup success. Companies that raise appropriate amounts based on specific milestones, rather than maximizing available funding, tend to build more sustainable businesses.
Long-term perspective: Understanding that valuation is “a hurdle for future behavior, not an award for past behavior” helps founders focus on building businesses capable of meeting or exceeding investor expectations over time.
Actionable Takeaways
Honest self-assessment: Use the statistical frameworks provided to realistically evaluate your startup’s funding probability. Consider factors like team experience, market validation, competitive position, and development stage.
Strategy selection: Given the low odds of external funding, develop parallel strategies that don’t depend on investor capital. This might include customer-funded growth, revenue-based financing, or strategic partnerships.
Execution focus: Regardless of funding strategy, focus on building real value through strong unit economics, customer satisfaction, and sustainable competitive advantages. The companies most likely to receive funding are often those that need it least because they’ve built strong underlying businesses.
The mathematics of startup funding are harsh but not insurmountable. By understanding the real probabilities, focusing on value creation, and developing multiple paths to success, founders can build thriving companies whether or not they join the 2% who successfully raise external funding.
Remember: the goal isn’t to get funded—it’s to build a successful, sustainable business. External funding is merely one potential tool in that journey, not the destination itself.