The number of Italian startups keeps on growing. According to the official register for innovative startups (startup innovative, in Italian) provided by the Chamber of Commerce (CoC), the number crossed the 5,000 mark in Q4 2015. But what’s the health of these companies? Are they active? What’s the average turnover? What’s the average time required to hit a certain turnover?
85% of Italian startups do not cross 100k in revenues
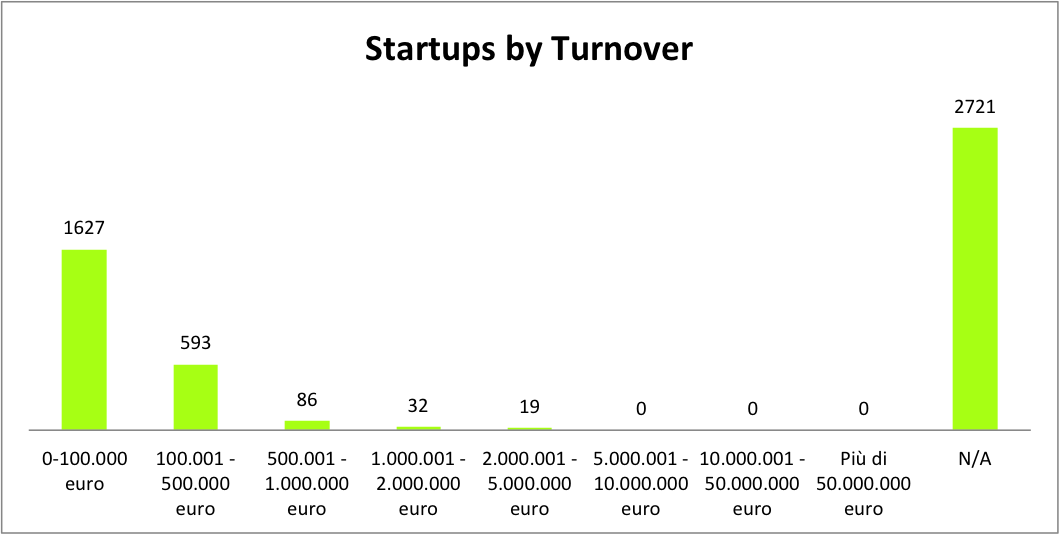
The excel export available on the startup-dedicated portal offers a good level of insights into the Italian Startup Scene. Based on the turnover classes as defined by the CoC, the breakdown of the Italian ecosystem is strongly skewed toward turnovers up to €100,000, with 1,627 startups representing 32% of the total.
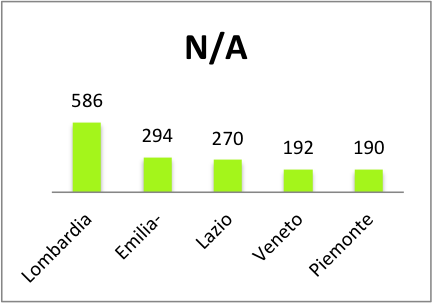
Summed to the 2,721 startups that reported no classification (meaning, they either didn’t start the operations or did not submit an annual account yet), 85% of all the startups are not crossing the 100.000 revenue mark.
Interestingly, no companies reported a turnover higher than €5m, maybe they stop being startups according to the Italian classification?
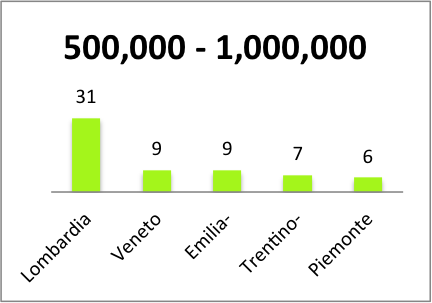
Here a count for each level of turnover:
The conclusion that Italian startups are still in their early days is also confirmed by their effective activity period, measured in years from the “effective operations starting date” as opposed to the “date of registration to the list” (both included in the database).
It takes about 28 months for a startup to reach 100k in revenues
Based on Equidam’s calculation to Jan 1st 2016, it takes approximately 2.35 years (28 months) for a startup to reach a turnover up to €100,000, an additional 9 months to cross into the 100,000 – 500,000 class. Past the first 3 years, startups seem to take the fast lane with an average of only 10 months of activity to get from up to half a million turnover to more than 2 million. Survival of the fittest?
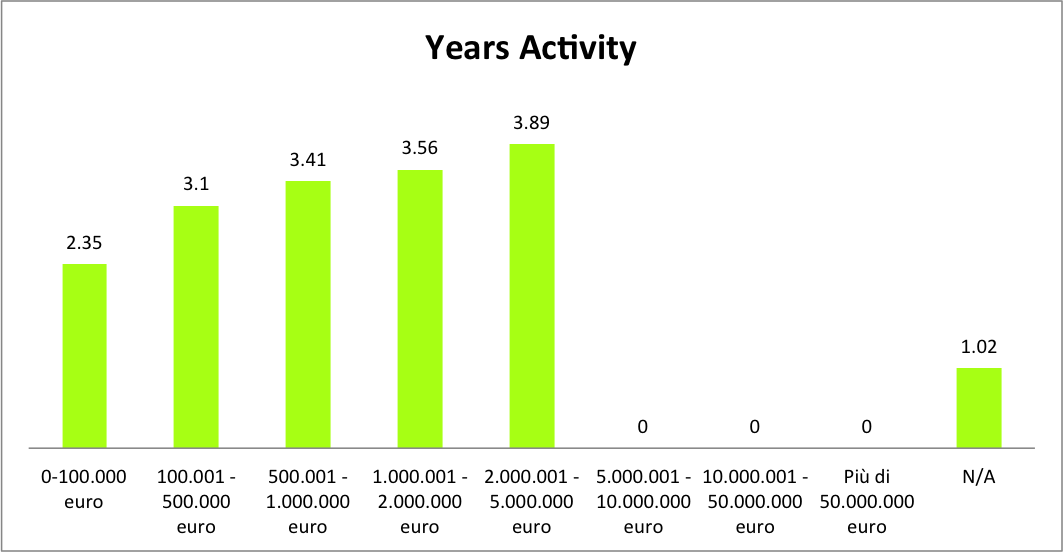
It’s also worthy to point out that there is a gap of 1.3 years (15-16 month) in between the non-classified startups and those in the first bracket. It seems that the majority of all companies (53%) struggles to get their company off the ground in the first instances.
This could suggest the presence of systemic obstacles, such as bureaucracy or lack of access to capital, or a lack of quality of the average business model. The Italian administrative burden is famous for imposing a heavy burden. But also a lack of “startup knowledge” could justify the gap.
Using Equidam, you can test your main assumptions and future projections. You can also compare yourself with thousands of similar companies!
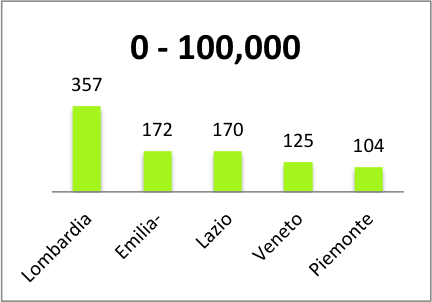
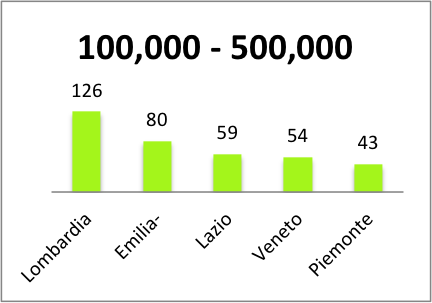
North Italy counts for the larger numbers
The data confirms another gap: the one between the north and the rest of Italy. Once the data is analyzed by region, the top 5 in each class are pretty much the same. Lombardy (Lombardia – the region of Milan) tops all of them, with Emilia-Romagna (the region of Bologna) being the underdog in most cases. Veneto (Venice) and Piedmont (Piemonte – Torino) also show up regularly in the top 5. Among the Center-South of Italy, only Lazio (the region of Rome) tanks well in the first 2 turnover classes.
Conclusion
We stumbled across these data almost by mistake during our regular activity of improvement for the Equidam’s valuation platform. The data has been particularly interesting as it confirms that starting, running and growing a startup is hard. I wouldn’t expect large differences between Italy and other European countries, and as soon as we collect similar data on other countries, we’ll update this post.
P.S. Feel free to contact us for comments, further research or general feedback!
Would you like to learn more about how your startup stacks against the competition? Get started with Equidam and check average revenue and profit growth compared to similar companies in your industry!
Italy is not unique in this way, many startups struggle to become profitable across the world. It is the culture of VC funding that keeps startup engines moving and encourages innovation; Italy needs to attract venture capital and management consulting firms to grow its startup economy. There are probably lots of brilliant technologies in Italy, but if they don’t get funded and are left to live off of immediate earnings, they are fighting a losing battle.